 Назад к блогу
Эта статья в настоящее время недоступна на вашем языке. Для английского рекомендуется использовать автоматический переводчик.
Mastering Market Movements: How to Use Bollinger Bands in Trading
Последнее обновление: 08/19/2024
In the world of technical analysis, Bollinger Bands stand out as a flexible and visually intuitive tool designed to help traders evaluate price action and volatility. Invented by John Bollinger in 1983, these bands are essential for identifying sharp, short-term price movements and determining potential entry and exit points. Let’s dive into what Bollinger Bands are, how they work, and how you can use them effectively.
What Are Bollinger Bands?
Bollinger Bands consist of three lines plotted on a price chart:
- Middle Band: This is a simple moving average (SMA), typically calculated over a 20-period timeframe. It serves as the central reference point for price action.
- Upper Band: This band is plotted two standard deviations above the middle band, reflecting potential resistance levels.
- Lower Band: This band is plotted two standard deviations below the middle band, indicating potential support levels.
The distance between the upper and lower bands varies with volatility: narrower bands suggest lower volatility, while wider bands indicate higher volatility.
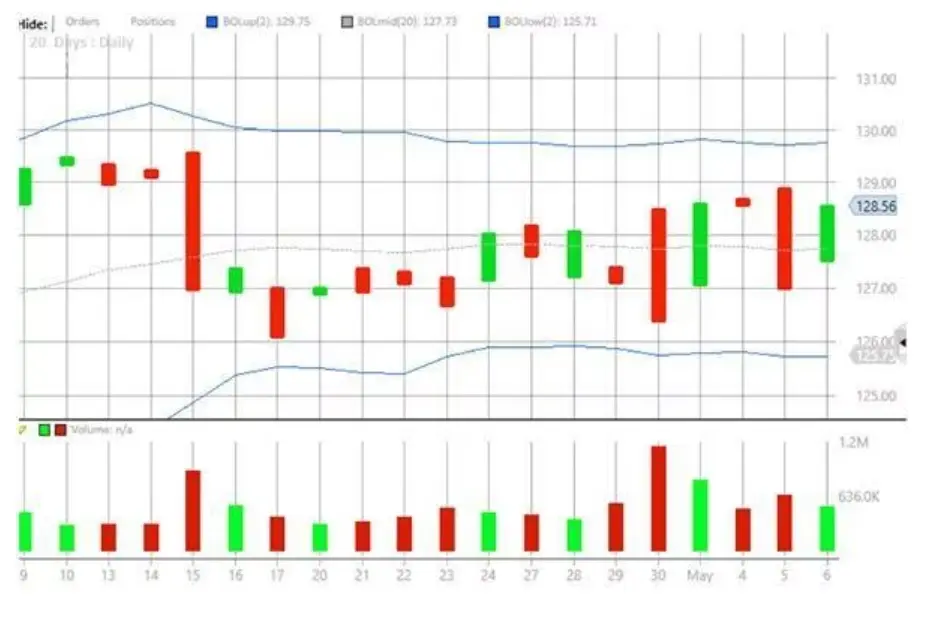
Figure 1: Bollinger Band activity over 20 days.
How to Use Bollinger Bands
1. Understanding Band Touches: When the price touches the upper band, it doesn't necessarily mean a sell signal, and similarly, a touch of the lower band doesn’t automatically signal a buy. According to John Bollinger, “There is absolutely nothing about a tag of a band that in and of itself is a signal.” Instead, it’s essential to look at the overall price behavior and chart patterns.
2. Recognizing Chart Patterns:
- Double Bottom: A double bottom pattern occurs when a stock experiences a drop, rises, then drops again close to the previous low, followed by another rise. This pattern can indicate a potential upward trend. If the price touches the lower band and then forms a second low within the band, it may signal a good buying opportunity.
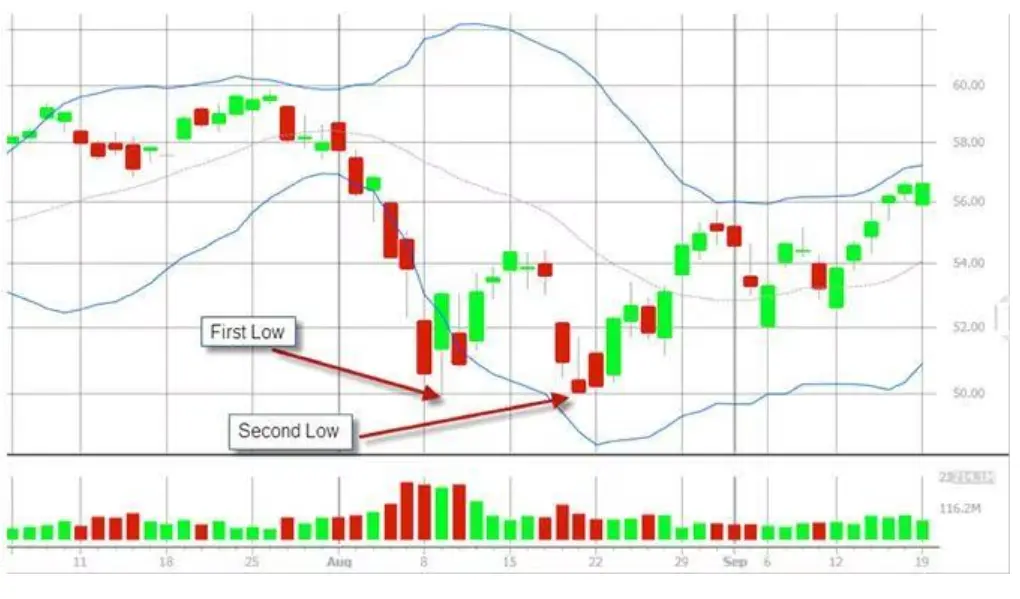
- Figure 2: The double bottom pattern.
Classic M Top: This pattern involves a price rise to a new high, followed by a pullback, and then a test of the previous high. The second high may be within the upper band, suggesting resistance. When the second high is lower or at the upper band, it can indicate a sell signal.
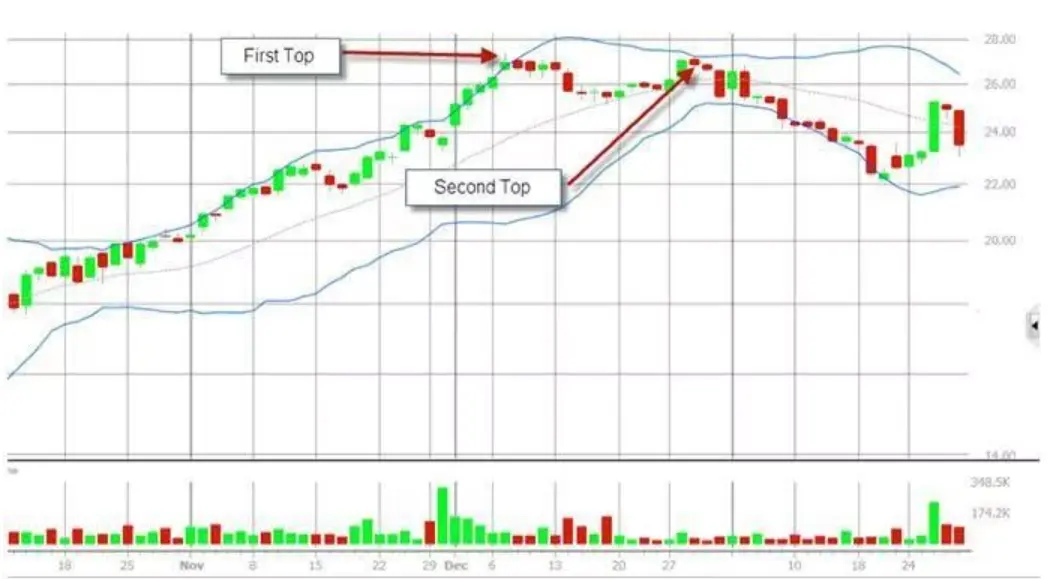
Figure 3: Classic M top pattern.
Three Pushes to High: This formation typically appears as a precursor to a more extensive topping pattern. It involves three successive highs: the first outside the upper band, the second at or near the upper band, and the third inside the band. This pattern often signals decreasing momentum and can be a reliable indicator of a potential market reversal.
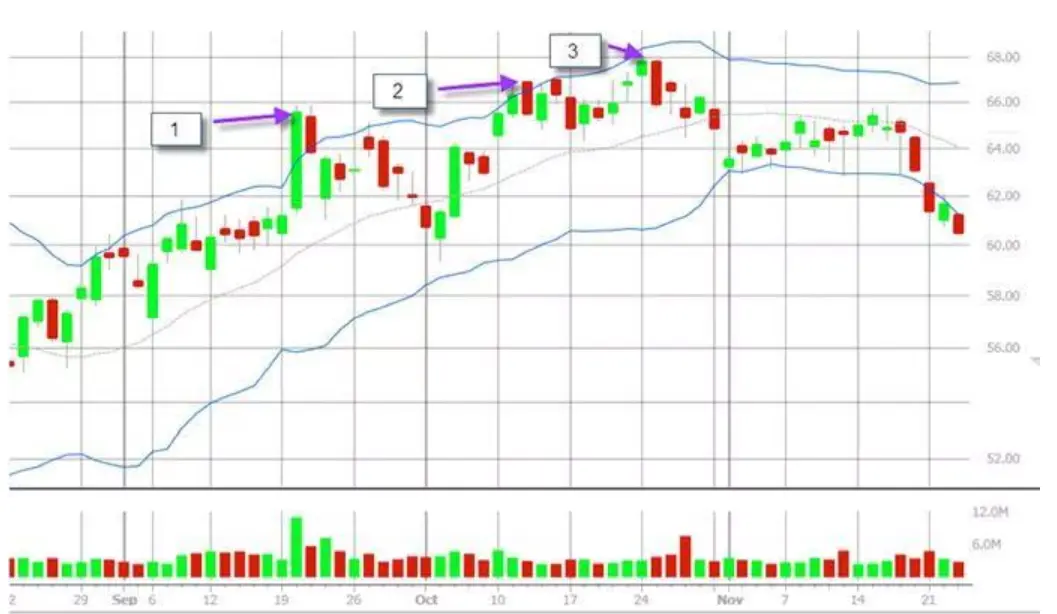
Figure 4: Three pushes to high pattern.
3. Identifying Trend Ends and Volatility Changes: Bollinger Bands can also help spot the end of strong trends. In a robust uptrend, for instance, the lower band may move downward despite the rising price. When the lower band turns back upward, it might signal that the upward move is nearing its end.
Furthermore, a squeeze—where the bands contract significantly—indicates low volatility. Since volatility is mean-reverting, a squeeze often precedes a substantial price move. Traders might look for buy or sell signals once the bands begin to expand.
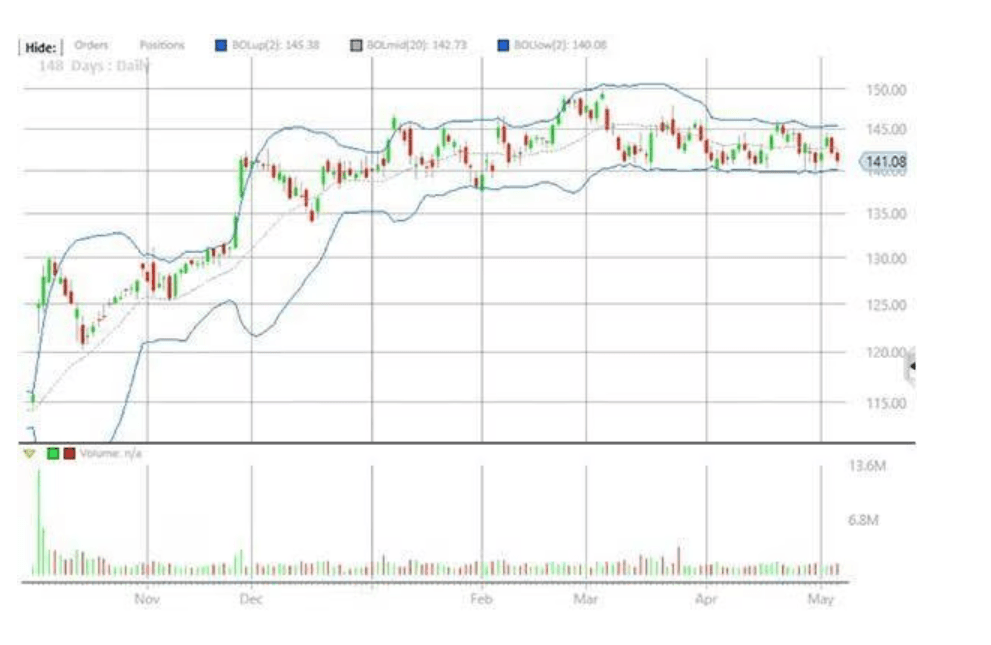
Figure 5: Bollinger Band squeeze.
4. Combining with Other Indicators: Bollinger Bands work well with other indicators, such as volume metrics or chart pattern tools. While they provide valuable insights, no single indicator can guarantee perfect trades. Combining Bollinger Bands with other tools can enhance your trading decisions.
Conclusion
Bollinger Bands offer traders a flexible, visually intuitive tool for analyzing price volatility and identifying potential trading opportunities. By understanding how to interpret the bands and incorporating them into a broader strategy, traders can better navigate short-term price movements and make more informed decisions.